Virtualized Automotive Software Development: Advanced Software Debugging (3/3)
Author: Meik Schmidt
Debugging is a critical part of software development. It involves identifying and fixing errors to ensure software operates correctly before it's integrated into the final product. The earlier a bug is detected and fixed, the lesser costs it incurs. Therefore, an efficient, convenient, and user-friendly debugging process is essential. This is especially true for developers working with the target software. However, the debugging workflow can vary significantly depending on the type of software being developed.
For example, debugging user-space applications on the same computer architecture as the target device is often straightforward, i.e. debugging x86 applications on an x86 workstation. Developers can launch the application within the debugger and use standard techniques like setting breakpoints, analyzing control flow, and evaluating the program state to track down bugs. However, debugging becomes more complex when developing for a different target architecture, i.e. developing Arm Cortex-M microcontroller software on an x86 workstation. In these scenarios, it is not possible to run the application natively on the development machine, which significantly complicates the debugging process and requires expensive hardware debug probes and software.
Fortunately, MachineWare’s Virtual Platforms (VPs) offer a solution. VPs allow you to execute unmodified binary programs for different architectures within a virtual hardware environment directly on the developer workstation while interfacing standard debug solutions. This enables developers to use familiar software development tools, such as debuggers, much like they would when debugging an application running natively on their host machine. We already discussed the integration of ecu.test – a commercial tool for testing physical and virtual electronic control units (ECUs) – in our previous blog post. These capabilities enhance the traditional software development workflow and boost productivity.
In this post, we'll demonstrate how various debuggers can connect to our VPs, explaining the underlying communication mechanisms and protocols. We'll also showcase how both open-source and commercial debuggers can be used effortlessly, leveraging their conventional and advanced features.
Debugging Scenario: Virtual ECUs and Automated Windshield Wipers
To illustrate the debugging process, we'll use the virtual Electronic Control Unit (vECU) application from our previous blog post.
In this scenario, three vECUs, connected via a virtual CAN bus, model the behavior of a vehicle's automatic windshield wiper system. One vECU simulates a rain sensor, while our VP functions as the vECU controlling the wiper speed based on the data sent from the rain sensor via the CAN bus. We use tracetronic ecu.test, an automotive testing software for ECUs, to define a test case that verifies the wiper speed is correctly set based on specific rain intensity thresholds.
Typically, the test case passes because the user-space application within the VP behaves as expected. However, to demonstrate debugging, we'll intentionally introduce a bug. This will illustrate how ecu.test would detect the error and how a debugger can be used to locate and correct it. Specifically, we'll manipulate the wiper vECU to return an incorrect speed based on the rain sensor value. As an example, we'll set the wiper speed to 0 (off) when the rain intensity is 66%.
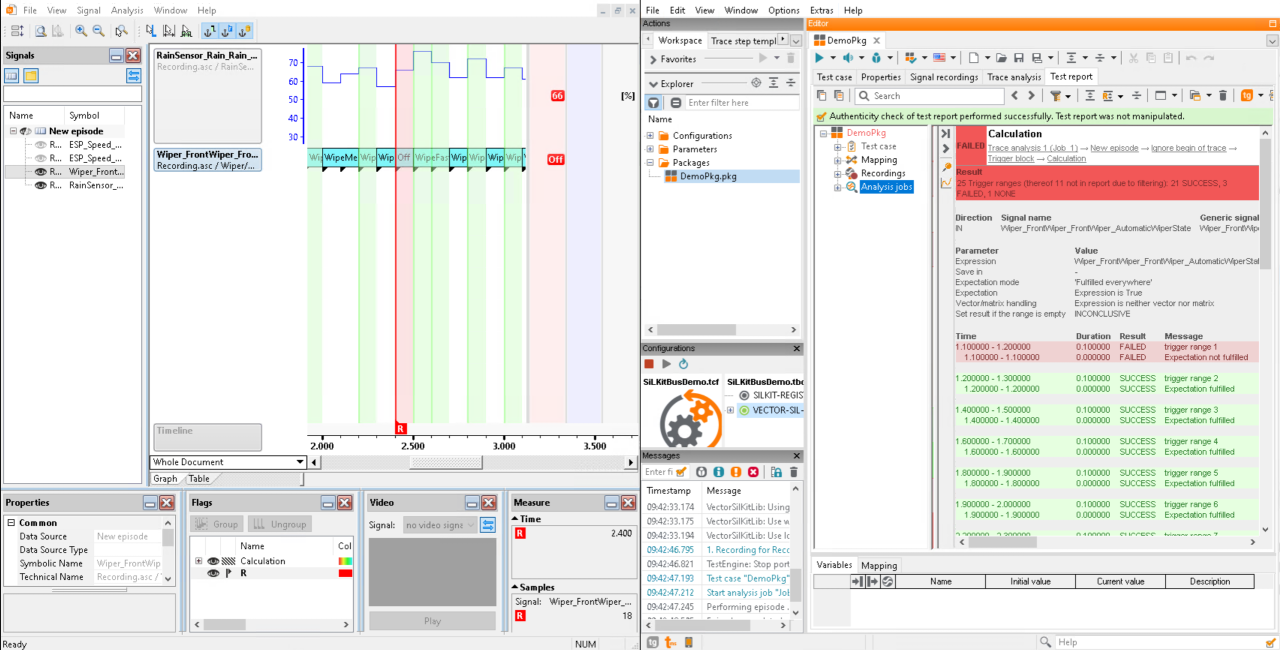
This injected bug allows us to showcase a complete workflow, from identifying a bug through testing to finding a solution. Typically, our test case is part of a CI/CD pipeline, automatically executing whenever code changes are made. With our introduced bug, the test case will fail, generating a report detailing the failure conditions. This is shown in Screenshot 1. On the right, we can see the test report for the failed test case. On the left, the values from the report are visualized and analyzed with a signal viewer. This analysis indicates that the failure occurs when the rain intensity reaches 66%, which provides a starting point for debugging.

vECU User Space and OS Kernel Debugging with GDB
Since our VPs boot a fully functional Linux operating system, standard Linux programs can be included and executed after the boot process. Therefore, we can launch our user-space application using gdbserver.
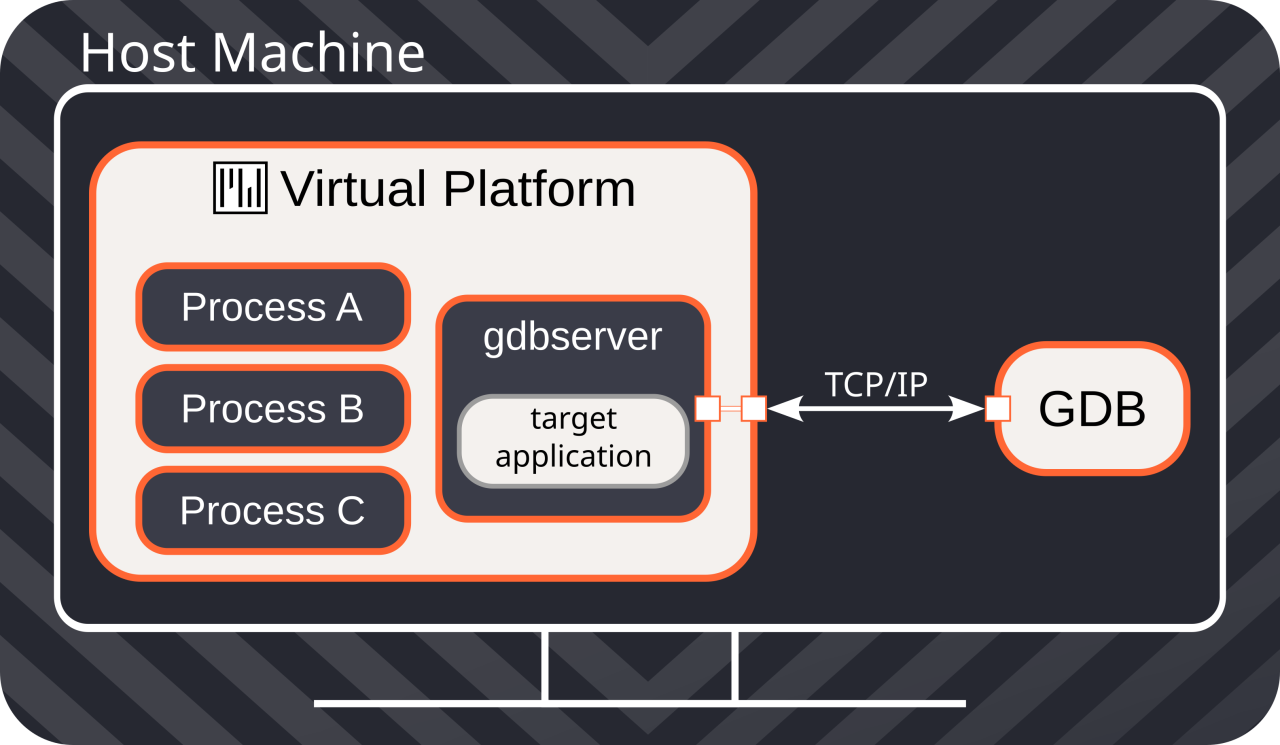
This opens a TCP port in the VP, which is forwarded to a local port on the host machine. This setup enables a standard GDB session for our target architecture, allowing us to connect to the forwarded port and debug the application running within the VP as if it were running natively on the host PC. This configuration is illustrated in Figure 1.

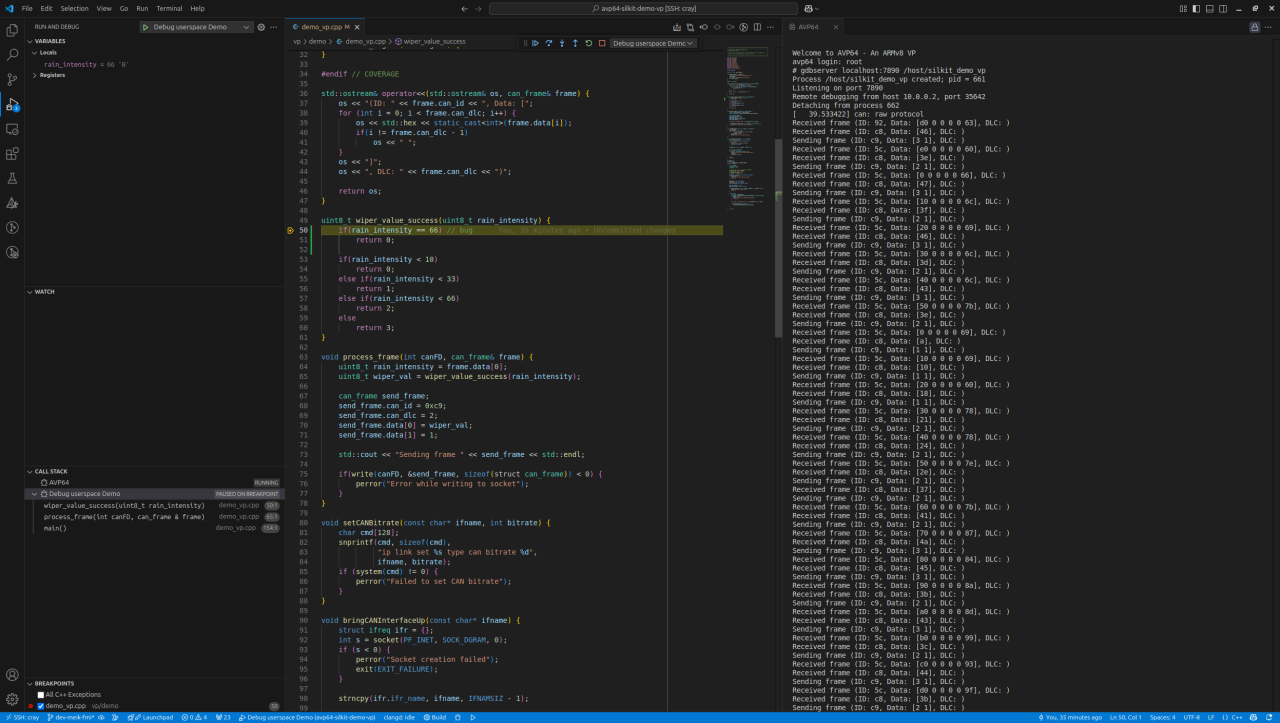
This approach facilitates a comfortable debugging experience, enabling developers to set breakpoints in the source code and monitor program information such as local variables and the call stack. Leveraging the information from our test report, we can set a conditional breakpoint in the source file that triggers when the rain intensity is 66%, allowing us to efficiently identify and resolve the bug by tracing the execution backward. GDB offers a comprehensive set of debugging functionalities. Its integration with Visual Studio Code (VS Code) makes the debugging process similar to debugging an application natively on the host, as illustrated in Screenshot 2. Both the VP and the GDB process are launched and controlled from within VS Code using its familiar GUI.

Beyond user-space applications, our VPs also support debugging of low-level software, including the Linux kernel and device drivers. VPs can be configured to initiate GDB sessions upon startup, pausing the boot process to await an incoming connection. This feature is valuable for debugging low-level code.
GDB is not the only debugger compatible with our VPs. The underlying communication protocol is the GDB Remote Serial Protocol [1], an open-source protocol supported by many debuggers. These debuggers can connect to the GDB sessions opened by the VP for low-level debugging or to the gdbserver instance running within the VP. Furthermore, MachineWare’s VPs offer support for the Multicore Debug API (MCD-API) [2], a standardized interface for debugging both real hardware and software simulations. This compatibility extends debugging capabilities to debuggers that support the MCD-API, such as the commercial debugger TRACE32 from Lauterbach GmbH.
Advanced vECU Debugging with Lauterbach TRACE32
Lauterbach TRACE32 [3] allows debugging of our application in a way that's similar to GDB, but it also provides advanced features that extend far beyond GDB's capabilities.
One of these advanced features is TRACE32's "OS Awareness." In essence, OS Awareness gives TRACE32 the ability to understand the operating system running on the target system – in our case, the Linux system within the VP. This understanding allows TRACE32 to extract and present detailed information about the operating system's state and behavior. Instead of just seeing raw memory and code, developers are presented with a contextualized view of the system.
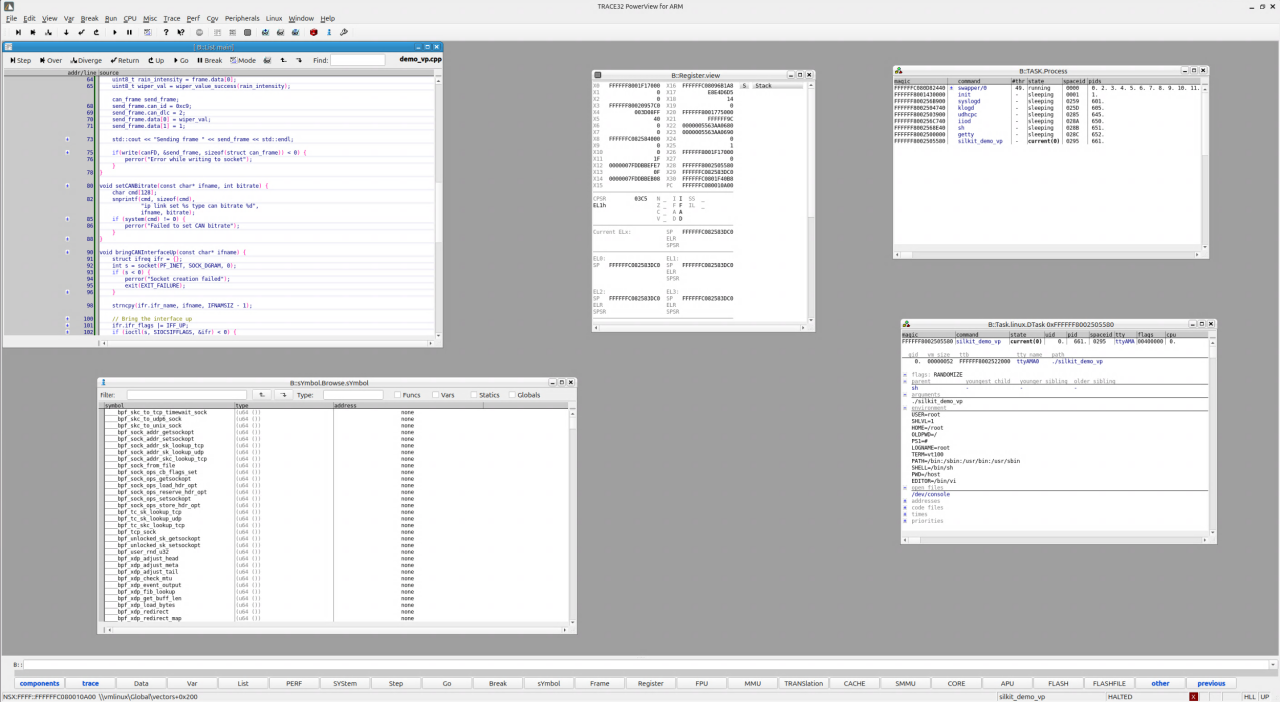
For example, OS Awareness enables developers to inspect and analyze various aspects of running processes, such as their priority, internal flags, open file descriptors, and memory allocation. This level of detail is invaluable for diagnosing complex issues related to resource contention, process interaction, and system stability. Furthermore, TRACE32 can dynamically adapt to the creation of new processes, automatically attaching to them and providing immediate debugging access. This eliminates the need for manual configuration, such as setting up a gdbserver as shown above, and ensures continuous monitoring of system activity. By providing this high-level, insightful view into the operating system, TRACE32 significantly streamlines the debugging process, allowing developers to quickly pinpoint and resolve even the most intricate software problems. Screenshot 2 shows the TRACE32 GUI while it is connected to our VP and utilizes the OS Awareness feature. It shows several example windows, each visualizing a different set of information. The source code is shown, symbols are listed, register values are evaluated, and information about the Linux process is displayed.

To bring this back to our initial example, TRACE32's advanced features can greatly simplify debugging the wiper control vECU. For instance, if we suspect a timing issue or resource conflict is causing the incorrect wiper behavior, TRACE32's OS Awareness allows us to monitor the vECU's processes in detail, observing process priorities, identifying interrupts, and analyzing CAN bus interactions. This detailed insight helps developers quickly pinpoint the root cause, whether it's a software flaw or system-level issue, and demonstrates how MachineWare’s VPs' versatility and debugger compatibility empower the effective use of advanced debugging features.
Summary
This blog post has provided a detailed overview of how MachineWare's (VPs) simplify and enhance the ECU software debugging process. We've demonstrated how VPs enable developers to seamlessly integrate their preferred debugging tools into their workflow, supporting both open-source options like GDB and commercial solutions like TRACE32. The ability to debug user-space applications, as well as low-level software like the kernel and device drivers, within a simulated environment offers significant flexibility and efficiency. Furthermore, we highlighted the advanced debugging capabilities offered by tools like TRACE32 with its OS Awareness feature, which provides invaluable insights into the operating system's behavior. By facilitating faster bug detection, more thorough software verification, and ultimately contributing to the development of safer software, MachineWare's VPs play a crucial role in reducing development costs and improving the quality of the final product. When combined with other tools in the development ecosystem, such as ecu.test, VPs offer a comprehensive solution for streamlining the entire ECU software development lifecycle.
